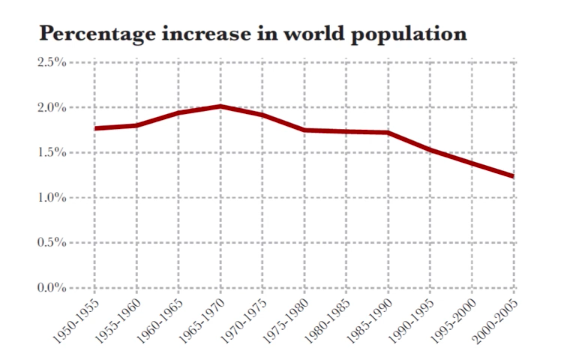
Ridley’s world population graph is considered a poor example of data visualisation because it lacks specific data, not allowing for deeper interpretation and analysis.
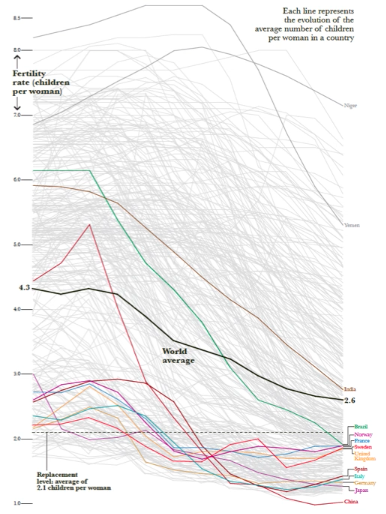
The above visualisation depicts the fertility rate of developed countries vs. developing countries. A key of colours is used in order to differentiate between each country, as well as a black line that refers to the world average.
Thoughts.
In order to create a successful data visualisation, the presentation must contain specific information which will therefore allow for deeper exploration, analysis and interpretation by the viewer.
References
Cmielewski, L. (2016). Visualisation: Historical and contemporary visualisation methods – Part 2[Lecture Pod]. Retrieved from https://vimeo.com/176255825
Ridley, M. (n.d.). The Rational Optimist: How Prosperity Evolves.
